

Alford-Bon | Tim & Faye | Sell · Buy · Invest
Q3 2026 vs Q3 2025
MLS snapshot: October 9, 2026
Price strength is concentrated.
Palo Alto and Los Altos have higher observed median prices per square foot, though Los Altos’ direction is borderline. San Jose shows no clear change. The data available to us does not identify buyers’ employers or the sources of their purchase funds.
This edition: Q3 price evidence, September cash buying, and the test for persistence.
Prices by sale-price band
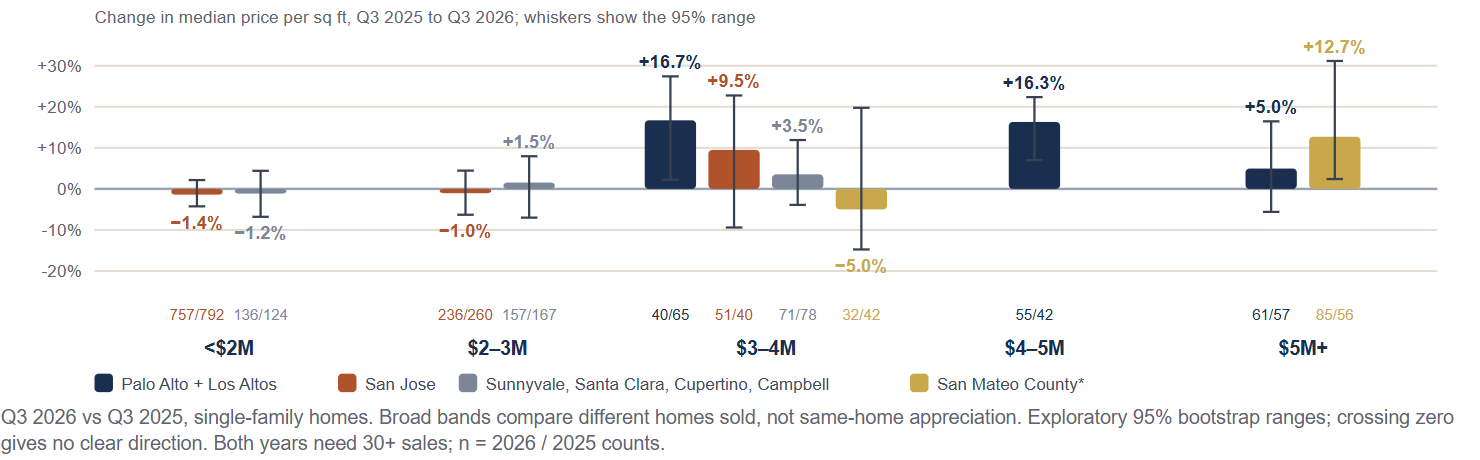
Q3 2026 vs Q3 2025, single-family homes. Broad bands compare different homes sold, not same-home appreciation. Exploratory 95% bootstrap ranges; crossing zero gives no clear direction. Both years need 30+ sales; n = 2026 / 2025 counts.
- Palo Alto + Los Altos · $3–4M: +16.7% (+2.3% to +27.4%); 40 / 65 sales.
- Palo Alto + Los Altos · $4–5M: +16.3% (+7.0% to +22.3%); 55 / 42 sales.
- Palo Alto + Los Altos · $5M+: +5.0% (−5.6% to +16.4%); 61 / 57 sales.
- San Jose · Under $2M: −1.4% (−4.3% to +2.2%); 757 / 792 sales.
- San Jose · $2–3M: −1.0% (−6.3% to +4.5%); 236 / 260 sales.
- San Jose · $3–4M: +9.5% (−9.4% to +22.8%); 51 / 40 sales.
- Sunnyvale, Santa Clara, Cupertino, Campbell · Under $2M: −1.2% (−6.8% to +4.4%); 136 / 124 sales.
- Sunnyvale, Santa Clara, Cupertino, Campbell · $2–3M: +1.5% (−7.0% to +8.0%); 157 / 167 sales.
- Sunnyvale, Santa Clara, Cupertino, Campbell · $3–4M: +3.5% (−3.9% to +11.9%); 71 / 78 sales.
- Selected San Mateo County · $3–4M: −5.0% (−14.8% to +19.7%); 32 / 42 sales.
- Selected San Mateo County · $5M+: +12.7% (+2.4% to +31.2%); 85 / 56 sales.
The local scoreboard
Single-family homes unless noted. Q3 = July–September closings, 2026 versus 2025. YoY = year-over-year; prior = 2025.
Peninsula · 4 cities
| Sales | 265 |
| Median price | $4,300,000 (+6.2% YoY) |
| Median $/sq ft change | +8.3%; 95% +2.6% to +13.2% |
| Sold / final asking | 106.7% (+2.2 points) |
| Below original asking | 31% (39% prior) |
| All cash | 32% (32% prior) |
| Oct. 9 price cuts | 16% |
Palo Alto
| Sales | 102 |
| Median price | $4,200,000 (+2.4% YoY) |
| Median $/sq ft change | +10.5%; 95% +2.7% to +18.9% |
| Sold / final asking | 108.7% (+3.5 points) |
| Below original asking | 24% (38% prior) |
| All cash | 35% (33% prior) |
| Oct. 9 price cuts | 23% |
Los Altos
| Sales | 72 |
| Median price | $4,910,150 (+14.2% YoY) |
| Median $/sq ft change | +11.4%; 95% +0.3% to +21.4% |
| Sold / final asking | 106.9% (+1.5 points) |
| Below original asking | 26% (41% prior) |
| All cash | 38% (30% prior) |
| Oct. 9 price cuts | 17% |
Los Altos Hills · thin sample
| Sales | 28 |
| Median price | $6,625,000 (+17.8% YoY) |
| Median $/sq ft change | −4.1%; 95% −17.6% to +12.6% |
| Sold / final asking | 98.2% (−2.5 points) |
| Below original asking | 64% (55% prior) |
| All cash | 39% (52% prior) |
| Oct. 9 price cuts | 11% |
Mountain View
| Sales | 63 |
| Median price | $2,925,000 (+14.8% YoY) |
| Median $/sq ft change | +13.9%; 95% −0.8% to +23.3% |
| Sold / final asking | 107.1% (+2.5 points) |
| Below original asking | 31% (32% prior) |
| All cash | 19% (20% prior) |
| Oct. 9 price cuts | 10% |
Selected San Mateo County · 5 cities
| Sales | 169 |
| Median price | $5,000,000 (+29.5% YoY) |
| Median $/sq ft change | +10.8%; 95% +0.3% to +19.7% |
| Sold / final asking | 103.2% (+3.3 points) |
| Below original asking | 40% (61% prior) |
| All cash | 46% (36% prior) |
| Oct. 9 price cuts | n/a |
Valley · 5 cities
| Sales | 1,434 |
| Median price | $1,769,000 (−1.1% YoY) |
| Median $/sq ft change | −1.6%; 95% −3.9% to +1.1% |
| Sold / final asking | 102.5% (−0.6 points) |
| Below original asking | 43% (42% prior) |
| All cash | 17% (16% prior) |
| Oct. 9 price cuts | 34% |
Sunnyvale
| Sales | 139 |
| Median price | $2,610,000 (−0.2% YoY) |
| Median $/sq ft change | +1.3%; 95% −7.6% to +8.6% |
| Sold / final asking | 106.1% (−0.6 points) |
| Below original asking | 23% (25% prior) |
| All cash | 14% (16% prior) |
| Oct. 9 price cuts | 22% |
Santa Clara
| Sales | 119 |
| Median price | $1,860,000 (−4.6% YoY) |
| Median $/sq ft change | +2.1%; 95% −3.8% to +7.2% |
| Sold / final asking | 104.2% (−1.1 points) |
| Below original asking | 37% (30% prior) |
| All cash | 17% (21% prior) |
| Oct. 9 price cuts | 30% |
Cupertino
| Sales | 57 |
| Median price | $3,015,000 (−11.2% YoY) |
| Median $/sq ft change | −4.9%; 95% −11.3% to +5.0% |
| Sold / final asking | 103.8% (−3.0 points) |
| Below original asking | 45% (21% prior) |
| All cash | 12% (15% prior) |
| Oct. 9 price cuts | 18% |
Campbell
| Sales | 58 |
| Median price | $2,004,000 (−5.2% YoY) |
| Median $/sq ft change | +3.6%; 95% −6.6% to +11.8% |
| Sold / final asking | 102.1% (0.0 points) |
| Below original asking | 53% (52% prior) |
| All cash | 22% (17% prior) |
| Oct. 9 price cuts | 31% |
San Jose
| Sales | 1,061 |
| Median price | $1,600,000 (−3.0% YoY) |
| Median $/sq ft change | −1.1%; 95% −3.4% to +1.2% |
| Sold / final asking | 101.8% (−0.5 points) |
| Below original asking | 46% (46% prior) |
| All cash | 18% (15% prior) |
| Oct. 9 price cuts | 36% |
Foothills · Los Gatos and Saratoga
| Sales | 154 |
| Median price | $3,205,000 (+0.1% YoY) |
| Median $/sq ft change | −2.8%; 95% −9.2% to +10.3% |
| Sold / final asking | 101.3% (+1.8 points) |
| Below original asking | 51% (58% prior) |
| All cash | 23% (20% prior) |
| Oct. 9 price cuts | 41% |
Townhomes and condos · 10 cities
| Sales | 750 |
| Median price | $872,500 (−10.0% YoY) |
| Median $/sq ft change | −8.8%; 95% −12.0% to −5.2% |
| Sold / final asking | 100.5% (−0.1 points) |
| Below original asking | 56% (57% prior) |
| All cash | 23% (21% prior) |
| Oct. 9 price cuts | n/a |
Multi-family · March–September closings
| Sales | 211 |
| Median price | $1,750,000 (−4.1% YoY) |
| Median $/sq ft change | Not compared: size and unit mix |
| Sold / final asking | 97.3% (−1.5 points) |
| Below original asking | 72% (64% prior) |
| All cash | 29% (35% prior) |
| Oct. 9 price cuts | n/a |
Q3 = July–September closings, 2026 vs 2025. Parentheses: year-ago share or change in points. Cut = reduced original asking price, among active/active-contingent listings with ≤180 days on market (DOM), Oct. 9. Multi-family: March–September; 4 current and 7 prior sales missing original list price excluded. n/a = unavailable. Los Altos and San Mateo ranges near zero are tentative.
What the housing split tells us
The price pattern
Combined Palo Alto/Los Altos $3M–5M bands rose. Each city’s band sample is too small to establish the same result. Home mix could explain part of the change.
The cash evidence
Q3 cash share: Peninsula 31.7% to 32.5%; selected San Mateo County 36% to 46%. Cash shares neither identify AI buyers nor count financed AI purchases.
A possible demand driver
Pay, paid bonuses or stock-sale proceeds could help buyers before an IPO. Tim’s clients report large AI packages; cash and vesting terms are unknown.
Monthly cash buying
September update: Peninsula 32.4% (34 of 105 financing-known sales), versus 33.3% in September 2025; Valley 19.8% (99 of 500), versus 15.6%. One month is a signal to follow, not proof of a trend.
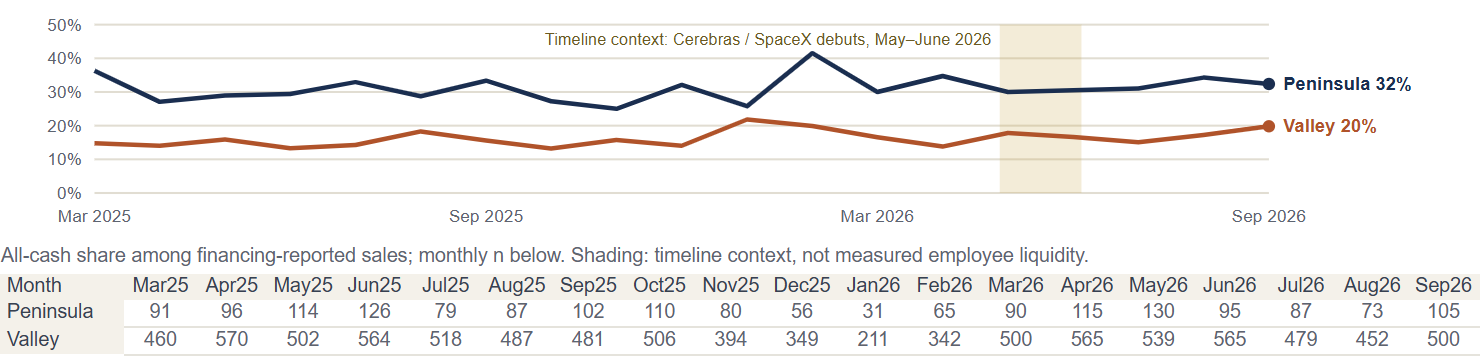
Timeline context: Cerebras and SpaceX trading began in May–June 2026. The timeline does not establish an effect on home buying.
| Month | Peninsula | Valley |
|---|---|---|
| 2025-03 | 36.3% 33 cash / 91 reported |
14.8% 68 cash / 460 reported |
| 2025-04 | 27.1% 26 cash / 96 reported |
14.0% 80 cash / 570 reported |
| 2025-05 | 28.9% 33 cash / 114 reported |
15.9% 80 cash / 502 reported |
| 2025-06 | 29.4% 37 cash / 126 reported |
13.3% 75 cash / 564 reported |
| 2025-07 | 32.9% 26 cash / 79 reported |
14.3% 74 cash / 518 reported |
| 2025-08 | 28.7% 25 cash / 87 reported |
18.3% 89 cash / 487 reported |
| 2025-09 | 33.3% 34 cash / 102 reported |
15.6% 75 cash / 481 reported |
| 2025-10 | 27.3% 30 cash / 110 reported |
13.2% 67 cash / 506 reported |
| 2025-11 | 25.0% 20 cash / 80 reported |
15.7% 62 cash / 394 reported |
| 2025-12 | 32.1% 18 cash / 56 reported |
14.0% 49 cash / 349 reported |
| 2026-01 | 25.8% 8 cash / 31 reported |
21.8% 46 cash / 211 reported |
| 2026-02 | 41.5% 27 cash / 65 reported |
19.9% 68 cash / 342 reported |
| 2026-03 | 30.0% 27 cash / 90 reported |
16.6% 83 cash / 500 reported |
| 2026-04 | 34.8% 40 cash / 115 reported |
13.8% 78 cash / 565 reported |
| 2026-05 | 30.0% 39 cash / 130 reported |
17.8% 96 cash / 539 reported |
| 2026-06 | 30.5% 29 cash / 95 reported |
16.6% 94 cash / 565 reported |
| 2026-07 | 31.0% 27 cash / 87 reported |
15.0% 72 cash / 479 reported |
| 2026-08 | 34.2% 25 cash / 73 reported |
17.3% 78 cash / 452 reported |
| 2026-09 | 32.4% 34 cash / 105 reported |
19.8% 99 cash / 500 reported |
Cash = financing exactly “All Cash No Loans”; reported = eligible sales with financing known. Monthly n varies. The data available to us does not identify buyers’ employers or the sources of their purchase funds.
AI wealth and the wider housing backdrop
Venture funding
$102B of $159BAI share of global venture funding, Q3 2026: 64%. Company funding, not household cash. Source
Evidence: HighTrading debuts
2 trading debutsCerebras May 14; SpaceX June 12, 2026. Employee sale rules differ. Cerebras / SpaceX
Evidence: HighEmployee share sales
$6.6B; about $7BReported OpenAI employee share sales: Oct. 2025; Aug. 2026. Housing use unknown. 2025 / 2026
Evidence: MediumDeals
Two deal typesScale: payouts announced June 2025. Groq/Nvidia: licensing and staff moves, Dec. 2025. Scale / Groq
Evidence: HighPublic-company equity
63M sharesNVIDIA awards vested companywide in six months to July 26, 2026. Not shares sold or local proceeds. Source
Evidence: HighAI compensation
Beyond salaryPave/Nua, Aug. 2026: senior AI researchers’ new-hire equity can reach millions. Vesting and sale terms govern cash access. Source
Evidence: HighMortgage backdrop
7.40%U.S. 30-year fixed, Oct. 8, 2026; 6.30% a year ago. Conforming benchmark; local jumbo rates vary. Source
Evidence: HighEmployment
Just over 14,000Bay Area tech cuts announced Jan.–Sep. 2026. Q3 slowed to 3,043 from Q2’s 7,962. Notices, not net jobs. Oct. 7 source
Evidence: MediumEvidence: High = direct company, official or data-provider source; Medium = credible reporting. Tags rate the cited fact, not its effect on housing.
What to expect
Watch the combined Palo Alto/Los Altos $4M–5M segment; Q3 strength could persist if demand outpaces desirable listings. Evidence above $5M is uncertain. Anthropic’s proposed IPO could add buying power if it proceeds and employees can sell; timing is unconfirmed. Weaker stocks or hiring could temper demand.
What we’ll watch next
Monthly: compare cash share, $5M+ sales and listings with a year ago; retain Q3 until Q4 closes.
Price test: compare year-over-year $/sq ft changes for pooled Palo Alto/Los Altos and Valley in the same bands over two completed, non-overlapping quarters. Require 30+ sales per area/year; assess uncertainty in the difference. Valley has too few sales above $4M for a firm comparison.
How to read the numbers
95% ranges: 4,000 resamples; exploratory, with home-mix limits. Multi-family: 210 financing-known sales per year. SCCAOR: pooled Q3 monthly counts for ten Santa Clara County cities, excluding Los Gatos, within 3%; 13 of 60 city-month gaps exceed 3% and remain unresolved.
Los Altos and selected San Mateo County remain borderline even when a particular resampling run ends just above zero. Identical samples reuse the same canonical interval. The ranges describe individual comparisons; they do not prove AI caused appreciation.
Sources and definitions
MLSListings through Oct. 9, 2026; SCCAOR. Peninsula = Palo Alto, Los Altos, Los Altos Hills, Mountain View. Valley = Sunnyvale, Santa Clara, Cupertino, Campbell, San Jose. Selected San Mateo County = Menlo Park, Atherton, Woodside, Portola Valley, Hillsborough. Foothills = Los Gatos, Saratoga. Townhomes and condos = 10 Santa Clara County cities; Los Gatos includes mountain areas. External facts checked Oct. 12; links above.
SCCAOR comparison does not cover Los Gatos, selected San Mateo County, townhomes and condos, or multi-family. Broad sale-price bands do not fully control home size, condition, lot, location or sale mix.
Download the two-page reportContact Us
Tim Alford & Faye Bon
(408) 832-7698
homes@alfordbon.com
Christie’s International Real Estate Sereno


General market information · Reviewed Oct. 13, 2026 · Not an appraisal or investment, tax or legal advice.