| MOUNTAIN VIEW MARKET REPORT |
NOVEMBER 2026 |
Alford-Bon | Tim & Faye | Sell · Buy · Invest
| |
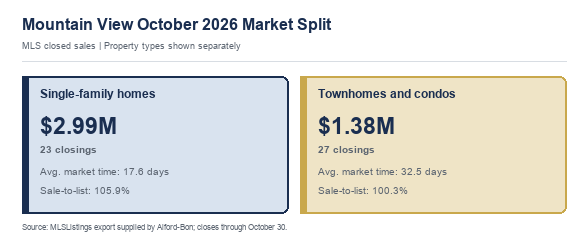
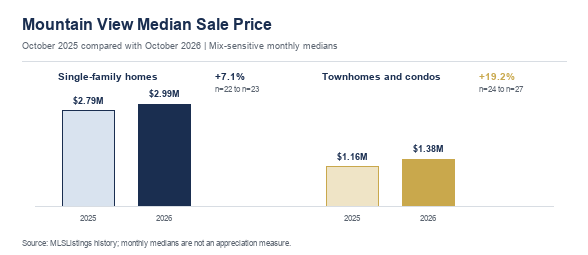
October produced 23 single-family home closings at a $2.989M median (+7.1% from October 2025) and 27 townhome-and-condo closings at $1.38M. Single-family homes averaged 105.9% of list; townhomes and condos averaged 100.3%.
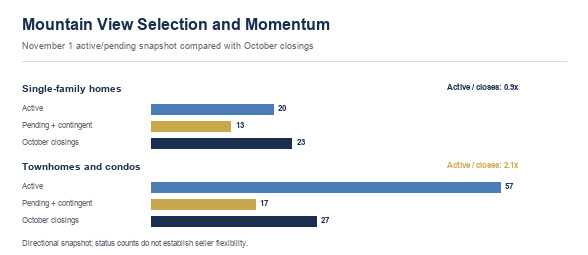
On November 1, 20 single-family homes and 57 townhomes and condos were active; 13 and 17 were pending or contingent. Monthly medians describe the homes sold, not appreciation. For one property, separate 94040, 94041, and 94043 and compare proximity, school assignment, lot, condition, and housing type; citywide figures are context, not the valuation or negotiating conclusion.
What this means:
- Homeowners and sellers: Separate 94040, 94041, and 94043 and price single-family homes apart from townhomes and condos. October showed 20 active single-family homes against 23 closings, while 57 active townhomes and condos gave buyers more choice.
- Buyers: A well-positioned single-family home may require competition when close alternatives are also pending; the larger townhome-and-condo selection supports more comparison. In either segment, confirm seller timing before choosing price, terms, timing, or no request.
- Tim & Faye
|
|
|
Mountain View Market
The Local Pulse
|
|
October 2026 at a glance
- Single-family homes: $2.989M median; 23 closings; 8.0-day median/17.6-day average; 105.9% of list.
- Townhomes and condos: $1.38M median; 27 closings; 13.0-day median/32.5-day average; 100.3% of list.
- November 1: single-family homes 20 active/13 pending or contingent; townhomes and condos 57/17. Active-to-October-closing ratios: 0.9/2.1.
- Financing: 7.24% national 30-year fixed average on October 29. With 20% down on the $2.989M benchmark, about $16,300/month principal and interest, before taxes, insurance, points, and fees.
|
|
Financing & Affordability
What the November Rate Picture Means
|
|
Freddie Mac's national 30-year fixed average was 7.24% October 29, versus 7.32% a week earlier and 6.17% a year earlier. At 20% down on the $2.989M median, principal and interest is about $16,300/month. PMMS is conforming-purchase data, not a jumbo quote or APR.
The $1.38M townhome-and-condo median is another entry point, but add HOA dues, insurance, assessments, parking, and condition. With 27 closings and 57 active listings, it does not describe every complex.
Many buyers use an ARM or temporary buydown and may refinance later if rates and qualification improve. Compare the reset date, index, margin, caps, maximum payment, and post-buydown payment with a fixed loan.
At the same seller net, compare a credit with a price reduction plus immediate repair, insurance, and HOA costs. The better structure can differ between a $2.989M single-family home and a $1.38M townhome or condo.
|
|
Market Behavior
What Is Moving
|
|
Lower-price closing - 255 S Rengstorff Avenue, #161: 1 bd, 1 ba, 551 sq. ft., townhome or condo. It closed for $420,000 after 157 days at 84.2% of list. One of 50 October closings, it shows range rather than a stand-alone valuation rule.
Middle-of-range closing - 1911 Stella Street: 3 bd, 2.5 ba, 1,609 sq. ft., townhome or condo. It closed for $1.77M after 69 days at 110.8% of list. One of 50 October closings, it shows range rather than a stand-alone valuation rule.
Upper-range closing - 3373 Beaumont Square: 6 bd, 6.5 ba, 4,164 sq. ft., single-family home. It closed for $6.398M after 8 days at 100.0% of list. One of 50 October closings, it shows range rather than a stand-alone valuation rule.
|
|
Market Behavior
Where Activity Stalls
|
|
Only 20 single-family homes were active on November 1 against 23 October closings, but individual homes still diverged by ZIP, condition, lot, and school assignment. Low broad supply does not eliminate property-specific mispricing.
Townhomes and condos had 57 active listings against 27 October closings and a 13-day median versus 33-day average market time. A slower tail remained even while some units sold quickly.
Older condo communities can lose momentum when HOA insurance, reserves, assessments, parking, or major-building work are unclear. Those ownership costs matter more than a low asking price alone.
|
|
Regional Comparison
Scarce Houses, Broader Townhome-and-Condo Choice
|
|
Realtor.com Economics, via NAR, reported September metro pending sales down 4.6% year over year. It is pipeline context, not a city valuation measure.
In Mountain View, single-family homes averaged 105.9% of list with an 8.0-day median; townhomes and condos averaged 100.3% with a 13.0-day median. That local split is more useful than the metro direction for current pricing and offers.
| |
Our read: Mountain View is not one market. Use the October segment results to identify the buyer pool, then compare current alternatives sharing the location, housing type, condition, and price range. |
|
|
What Changes Next
Local Community Watch
|
|
North Bayshore remains approved for up to 7,000 homes, while Shoreline Gateway remains a pending 1,914-home application. Neither plan should be described as delivered housing or a current resale comparable.
The City still estimated December 2026 construction starts for the 85-home Montecito project and the 79-home 96 W. El Camino project. As of November 1, those remained future schedules rather than confirmed construction starts.
Residents should watch permits, infrastructure commitments, the two affordable-housing schedules, and construction phasing. These projects can change Mountain View's housing and traffic map over time, but current status ranges from approved capacity to pending application and scheduled future work. Track each project's status separately; plan capacity is not current inventory or a comparable sale today.
|
|
Six-Month Outlook
Our Base-Case View
|
| Segment |
Expected direction |
Why |
| Turnkey single-family homes in 94040 and 94041 |
Competitive |
Only 20 were active versus 23 October closings, and the segment averaged 105.9% of list. |
| Single-family homes with location or condition tradeoffs |
Property specific |
ZIP, lot, school assignment, and renovation scope still determine the buyer pool. |
| Townhomes and condos |
More buyer choice |
Fifty-seven active listings versus 27 October closings expose HOA and layout differences. |
| North Bayshore and Shoreline Gateway |
Long-term change |
Permits and infrastructure - not plan capacity - determine when new housing reaches residents. |
|
|
Through spring 2027, Mountain View should remain segmented by neighborhood, housing type, condition, and price. The 20 active single-family homes and 57 townhomes and condos are context; the closest alternatives determine competition for one home.
Lower rates or stronger equity confidence could broaden demand; sustained payment pressure, ownership costs, or diligence problems could lengthen market time. This outlook is not a guarantee of value.
|
|
Recommendations
What Matters Now
|
|
For homeowners:
- Separate a Mountain View value review by 94040, 94041, or 94043, then match school assignment, transit or downtown proximity, lot, condition, and housing type; the $2.989M October single-family home median combines different buyer pools.
- For a townhome or condo, retain the HOA budget, reserves, insurance, assessment history, parking, and major-project records before estimating equity; 57 active listings give buyers many complex-level comparisons. In newer communities, also compare warranty coverage.
- Use the 66 single-family home closings from August through October to test October's 7.1% year-over-year median increase; the longer window reduces the risk of treating one month's mix as appreciation.
For sellers:
- For a 94040 or 94041 single-family home, compare first-week response with nearby homes going pending around the eight-day median; if your home trails those alternatives, adjust price or presentation despite the low citywide active count.
- For a 94043 townhome or condo, give buyers complete HOA and building information before launch and price against the 57 active choices; the segment's 13-day median and 33-day average show both fast sales and a slower tail.
- Near Caltrain, downtown, or major employment corridors, document the actual walk, noise, parking, and access tradeoffs rather than relying on a broad proximity claim; buyers compare those daily-use details across neighborhoods. Do not price an unbuilt project benefit as current access.
For buyers:
- Compare a Mountain View listing with active and recently pending homes in the same ZIP, school pattern, housing type, condition, and price range. Track price changes, missed offer dates, returns to market, new competitors, and concessions, then confirm seller timing with the listing side before changing price, terms, timing, or making no request.
- For a scarce single-family home, use the 0.9 active-listing-to-October-closing ratio as context for competition, but still test the home against its closest alternatives before deciding how far above or below list to offer.
- For a townhome or condo, compare mortgage, HOA dues, insurance, assessments, parking, and likely building work across the 57 active choices; the $1.38M October median cannot rank the financial strength of each complex.
|
|