| PALO ALTO MARKET REPORT |
OCTOBER 2026 |

Alford-Bon | Tim & Faye | Sell · Buy · Invest
| |
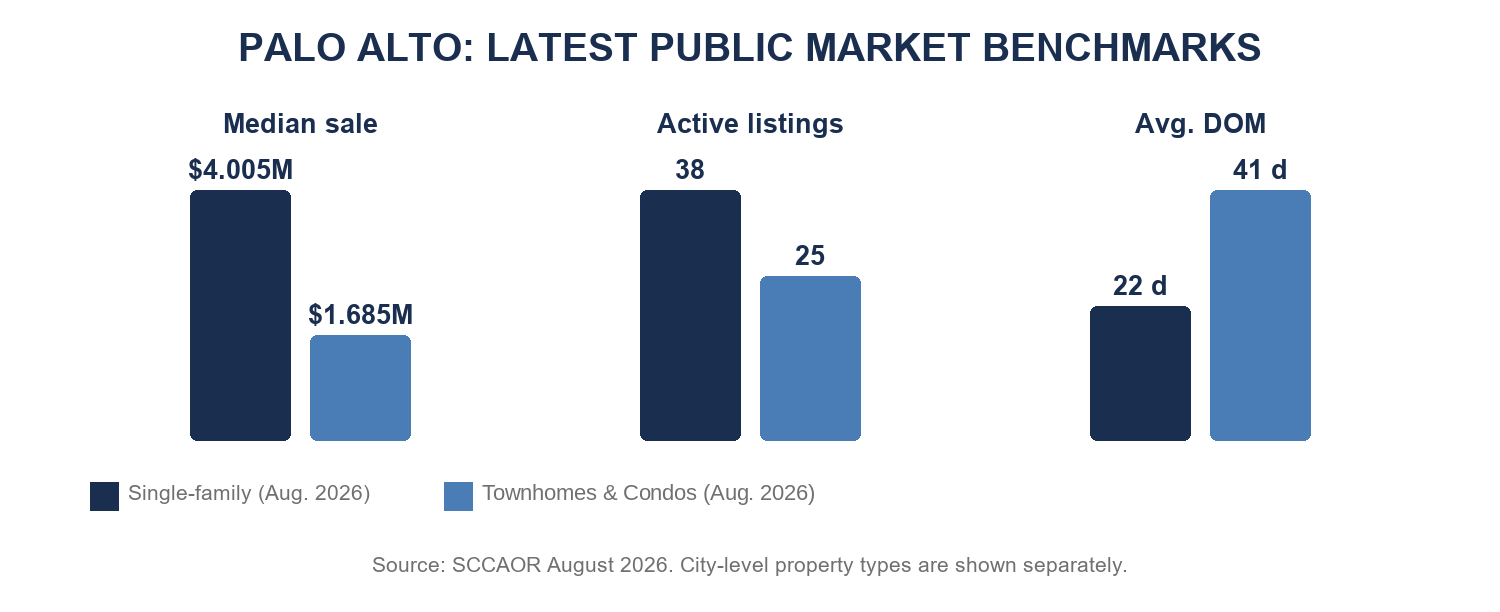
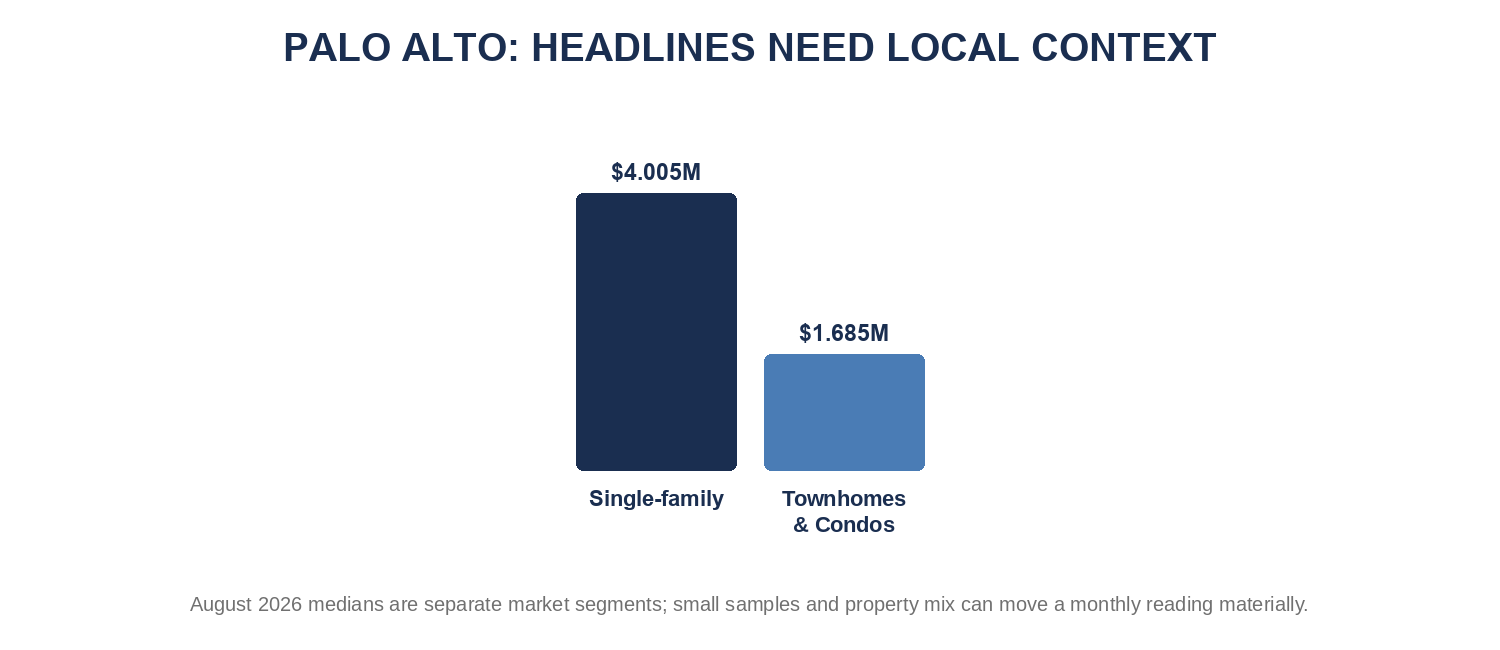
What changed since last month: financing tightened again, while Palo Alto's strongest single-family homes and more negotiable alternatives continued to move at different speeds. Single-family homes recorded a $4.005M median across 32 closings, 111% of list price, and 22 average days on market. Townhomes and condos recorded a $1.685M median across 7 closings, 99% of list, and 41 average days.
From July to August, the first segment's median changed -6.4% and the second changed +17.2%. Those are month-to-month changes in the homes that happened to close, not an appreciation measure. The practical signal is the relationship among price, pace, list-price performance, and available alternatives. A polished home priced to match recent nearby sales can still attract several buyers quickly. A nearby home may sit longer when its condition, setting, disclosures, or asking price compares poorly with other available homes.
What this means:
- Homeowners and sellers: Compare single-family homes, townhomes and condos, and redevelopment properties separately, then narrow by neighborhood, lot, condition, and school area. A citywide median can hide large differences.
- Buyers: Houses averaged 111% of list; townhomes and condos averaged 99% with more supply. Compare the home with its closest segment and neighborhood competitors, watch for a price change, missed offer date, or return to market, and confirm the seller's timing before choosing price or terms.
- Tim & Faye
|
|
|
Palo Alto Market
The Local Pulse
|
|
August 2026 at a glance
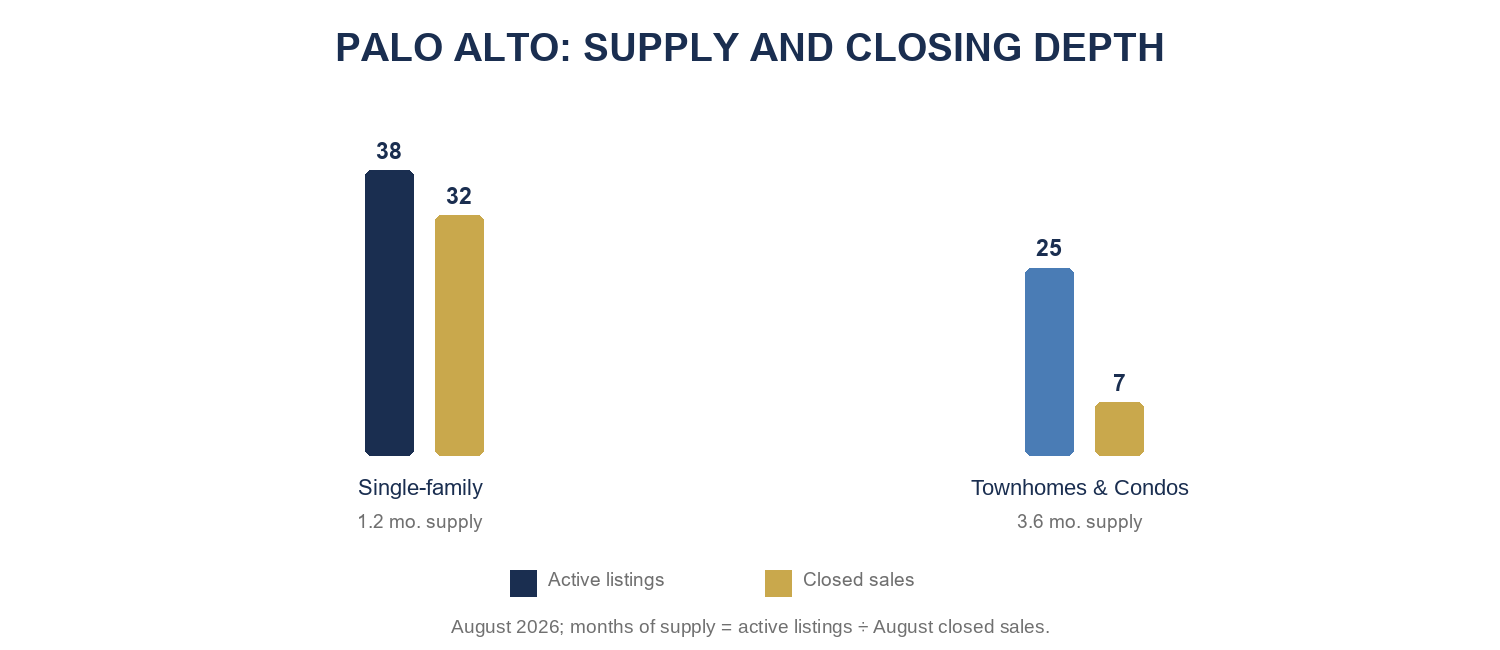
- Primary benchmark: Single-family: $4.005M median; 32 closings; 22 average days; 111% sale-to-list; 1.2 months of inventory.
- Comparison signal: Townhomes and condos: $1.685M median; 7 closings; 41 average days; 99% sale-to-list; 3.6 months of inventory.
- Selection and pace: Sample and selection: 39 closings across the shown market segments and 63 active listings; medians can be distorted when only a few homes sold or the mix of homes changed.
- Financing: the national 30-year fixed average was 7.28% on October 1. At that rate, 20% down on the $4.005M benchmark implies roughly $21,920 per month in principal and interest before taxes, insurance, and other costs. Pricing can differ by loan and borrower.
|
|
Financing & Affordability
What the October Rate Picture Means
|
|
Freddie Mac's national 30-year fixed average was 7.28% on October 1. With 20% down on the $4.005M benchmark, the illustrative principal-and-interest payment is about $21,920 per month, before property tax, insurance or other obligations. This is a planning illustration rather than a loan quote; pricing, points and borrower profiles can differ materially. The Federal Reserve raised its target range by one-quarter point on September 16; mortgage rates do not move one-for-one with that policy rate, so buyers should compare the actual fixed-rate, adjustable-rate, and buydown quotes available for their loan size.
C.A.R.'s second-quarter affordability index found that 22% of Santa Clara County households could afford the county's $2.05 million median single-family home. Its model required about $510,800 in annual income at a 6.54% effective rate. Palo Alto's townhomes, conventional houses, and luxury or custom homes attract buyers with different budgets, down payments, and financing options; one regional employment headline cannot explain demand for all of them.
Many buyers are using adjustable-rate mortgages or temporary buydowns to reduce the initial payment while preserving the opportunity to refinance if fixed rates improve. That can be practical for a buyer with strong liquidity, expected income growth, or a defined holding period, but the adjustment schedule, rate caps, and future payment range should be compared with a fixed-rate option before offer day.
A targeted seller credit can sometimes address payment pressure more efficiently than a broad price reduction. Buyers should compare that benefit with the property's immediate repair, insurance, and ownership costs.
|
|
Market Behavior
What Is Moving
|
|
Entry-priced condo — 101 Alma Street, No. 608. The two-bedroom, two-bath, 1,531-square-foot condo closed August 14 for $1 million. It shows a Palo Alto ownership entry point well below the single-family headline, but property type, HOA obligations, size, and condition remain essential to the comparison.
Near the single-family median — 991 Lincoln Avenue. The three-bedroom, two-bath, 1,599-square-foot home closed August 10 for $3.95 million, close to August’s $4.005 million single-family median. It is a useful benchmark, not a substitute for comparing lot, condition, school assignment, and immediate competition.
Upper-market sale — 1408 Edgewood Drive. The four-bedroom, three-and-one-half-bath, 3,759-square-foot home closed August 7 for $9.42 million. The result shows that exceptional Palo Alto properties can attract buyers with different budgets and priorities than a typical resale.
|
|
Market Behavior
Where Activity Stalls
|
|
Townhomes and condos with unresolved ownership costs. A 41-day average and 99% of list point to real negotiating room and strong sensitivity to reserves, insurance, assessments, and building condition.
Single-family homes that miss the first offer cycle. When houses average 22 days, a listing that sits is delivering a specific message about price, condition, location, or risk.
Overreliance on AI headlines. New wealth can deepen the premium pool, but it does not eliminate functional, zoning, noise, or condition discounts.
|
|
Regional Comparison
AI Wealth: Relevant, Not the Whole Story
|
|
Independent reporting suggests AI-company equity and liquidity events are already influencing unusual high-end transactions around San Francisco. Palo Alto has a stronger direct link to founders, venture capital, Stanford, and Peninsula technology employment than most South Bay cities.
The likely effect is concentrated: exceptional single-family homes benefit first. Townhomes, condos, and compromised houses still trade on practical ownership economics, not on a blanket wealth effect.
| |
Our read: Palo Alto's best single-family homes should remain competitive, while higher financing costs and more choice create leverage in less distinctive or overreaching listings. |
|
|
What Changes Next
Local Community Watch
|
|
North Ventura has moved beyond planning debate into implementation. Palo Alto adopted the coordinated area plan in August 2024, creating a framework for more housing, services, parks and safer connections near California Avenue.
Why residents should care. Future projects can broaden housing choice and reshape the California Avenue area's public realm, but the plan is a framework; individual sites still need proposals, review, financing and construction.
What to watch next. Track the first significant applications, infrastructure funding and park or streetscape commitments. North Ventura is a longer-term community story, not a material driver of today's resale statistics.
|
|
Six-Month Outlook
Our Base-Case View
|
| Segment |
Expected direction |
Why |
| Prime single-family |
Very competitive |
1.2 months of supply and 111% of list. |
| Project / expansion homes |
Selective |
Land value strong; execution risk matters. |
| Townhomes and condos |
Negotiable |
41 average days and 99% of list. |
| Top luxury |
Event-driven |
AI and venture liquidity can deepen bids. |
|
|
Prediction: Palo Alto should remain a two-speed market. Prime single-family homes are likely to retain strong pricing power even with seasonal cooling. Townhomes and condos should continue to reward careful selection and negotiation. AI-related liquidity may produce notable upper-tier sales without moving every citywide measure evenly.
This is a market outlook, not a guarantee of future value. Property condition, micro-location, school assignment, lot, architecture, insurance, and financing can materially change an individual result.
|
|
Recommendations
What Matters Now
|
|
For homeowners:
- value single-family homes, townhomes and condos, and redevelopment candidates separately; citywide averages are especially misleading here.
- preserve permit, survey, systems, and improvement records because planning certainty carries value.
- Separate the 32 single-family closings from the seven townhome-and-condo closings; the 111% versus 99% sale-to-list split makes a citywide appreciation conclusion unreliable.
For sellers:
- complete preparation before launch; the first two weeks on market are difficult to recreate.
- At 3.6 months of supply and 41 average days, a townhome or condo must answer HOA and building-condition questions before buyers compare it away.
- For redevelopment or older homes, provide survey, permit, systems, and improvement records before launch; uncertainty over usable potential can cost more than cosmetic condition.
For buyers:
- For a prime house, set the ceiling before offer day; 111% of list leaves little room to rely on a later negotiation.
- look for negotiating room in townhomes, condos, and homes listed longer than similar properties, but include likely HOA assessments and insurance cost in the price you are willing to pay.
- For a redevelopment candidate, verify lot, survey, permit path, tenant status, and school assignment before pricing the upside; uncertainty in what can be built belongs in the offer ceiling.
|
|