August 2026
Silicon Valley Market Report

| ALFORD-BON Market Update | AUGUST 2026 |

| CLICK TO VIEW ONLINE |
|

LOOKING TO BUY A HOME?
[CLICK THE PHOTO TO SEARCH] |
LOOKING TO SELL A HOME?
[CLICK THE PHOTO FOR YOUR REPORT] |
|
National
National Market Outlook
|
|
Note: You can find the charts & graphs for the National Market Outlook at the end of this section. *National Association of REALTORS® data is released approximately one month behind; June 2026 remains the most recently published NAR report as of this writing. July and August 2026 are estimated where indicated; the July report is scheduled for release August 11, 2026. |
|
Mortgage Rates Hit an 11-Month High as Inflation Data Delays Fed Relief
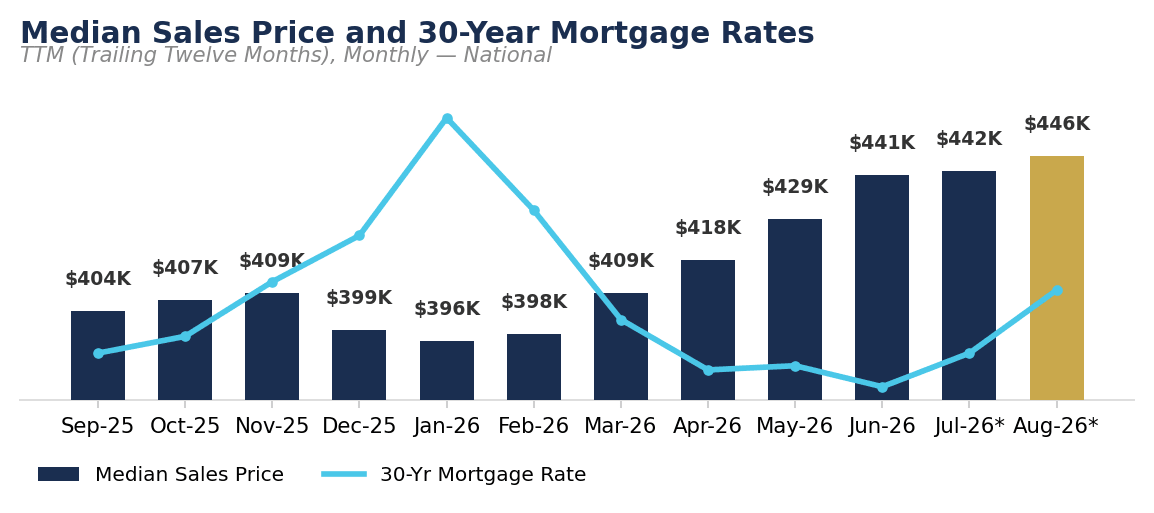
The Freddie Mac 30-year fixed-rate mortgage averaged 6.69% for the week ending August 6 — the highest reading in roughly 11 months — extending a steady climb from 6.43% in early July. Reaccelerating inflation, with CPI and PCE both running well above the Fed's 2% target since March, has pushed back expectations for near-term rate cuts even as job growth outside the tech sector shows signs of cooling. For most of the country, that's a meaningful headwind. In Silicon Valley, the more consequential story is what higher-for-longer rates are doing to supply: with nearly half of all outstanding U.S. mortgages carrying a rate below 4%, long-time owners have little financial incentive to sell and re-buy near 6.7%. That "rate lock-in" effect is arguably a bigger constraint on local inventory than anything happening on the demand side. |
|
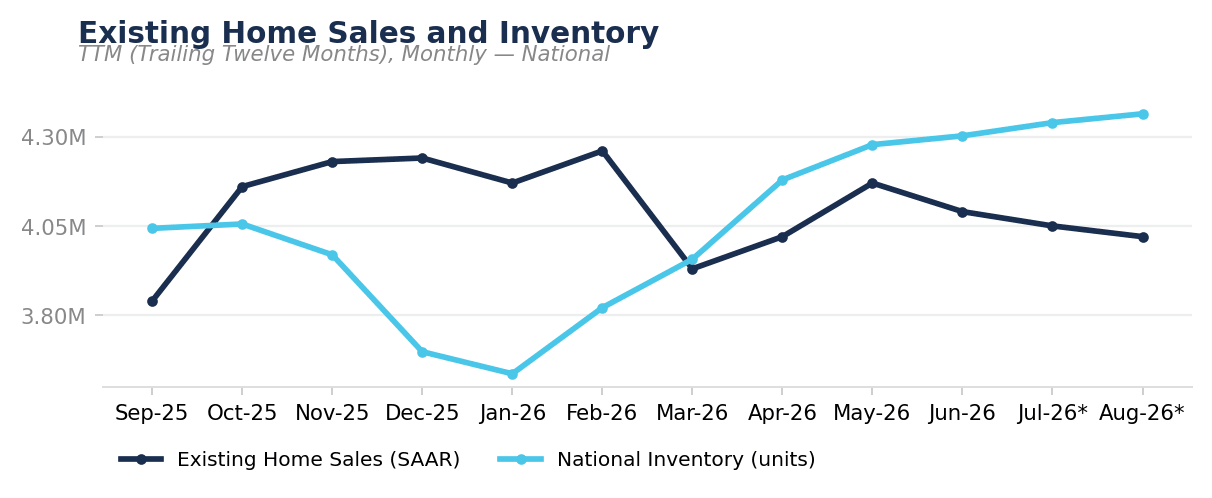
June's 4.09 Million Sales Pace Holds as Buyers Wait on the July Report
The most recent NAR data — covering June — showed existing-home sales at a 4.09 million seasonally adjusted annual rate, up 2.8% from a year earlier, with the national median sale price at $440,600, a 1.8% year-over-year gain and the 36th straight month of annual price increases. NAR's July Existing-Home Sales report is scheduled for release on August 11, and with mortgage rates having climbed through the month, most forecasters expect a modest pullback in transaction volume. National inventory stood at 4.6 months of supply in June, still short of the 6-month line that separates buyer's and seller's markets. That national looseness continues to bypass supply-constrained coastal markets like Silicon Valley, where rate lock-in and structural undersupply keep conditions tight regardless of what's happening nationally. |
|
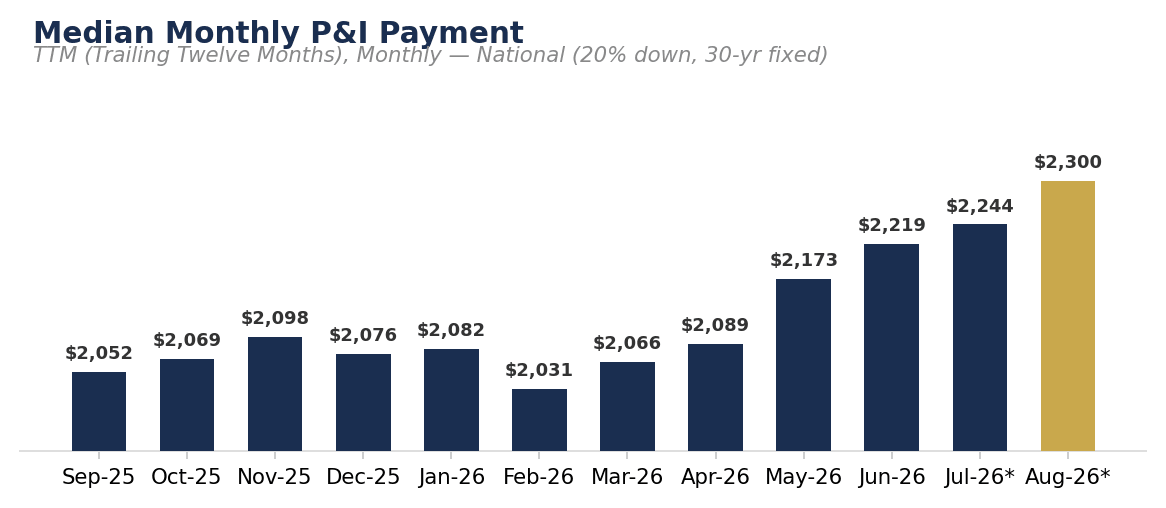
National Monthly Payments Approach $2,300 as Rates Reach New Highs for the Cycle
Nationally, at today's rates, the estimated monthly principal and interest payment on the median-priced U.S. home ($446,000, 20% down at 6.69%) is approaching $2,300 — up from about $2,244 in July and $2,219 in June, as the 30-year rate's climb outpaces the modest slowdown in price growth. That would mark a new cycle high, surpassing the $2,240 peak set in June 2025. Local Market
Silicon Valley: A Different Scale
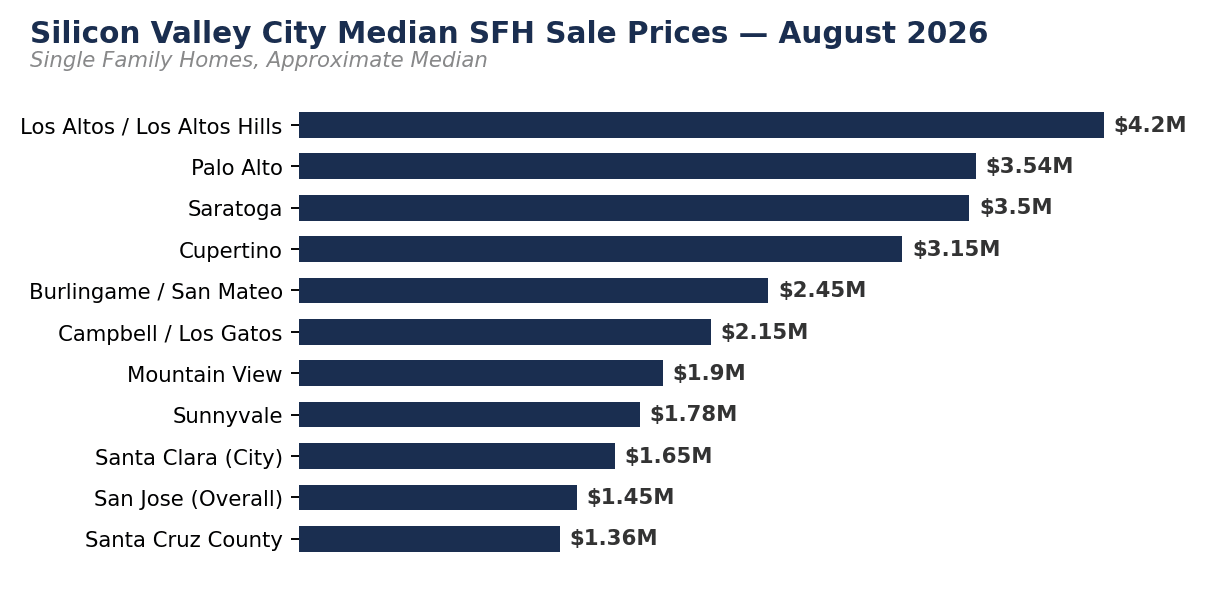
At the Valley Floor, San Jose's roughly $1.45M overall median (20% down at 6.69%) carries an estimated monthly P&I near $7,500 — already more than triple the national figure before you reach any of the valley's premium enclaves. Move up to Palo Alto's $3.5M+ median and, at the same 80% loan-to-value assumption, the estimated payment climbs above $18,000 a month. In practice, few buyers at that price point finance 80% of the purchase — equity, stock compensation, and rollover proceeds from a prior home typically bring the real monthly number down well below this illustrative figure. As this month's Silicon Valley Spotlight shows, AI-driven wealth creation and tech-sector employment shifts are doing far more to shape local pricing than the national rate cycle. |
| National Data |
|
|
|
|
Local Market
Silicon Valley Spotlight
|
|
Note:You can find the charts/graphs for the Silicon Valley Spotlight at the end of this section. |
|
A Tale of Two Counties: AI Wealth Lifts the Peninsula While Layoffs Weigh on the Core
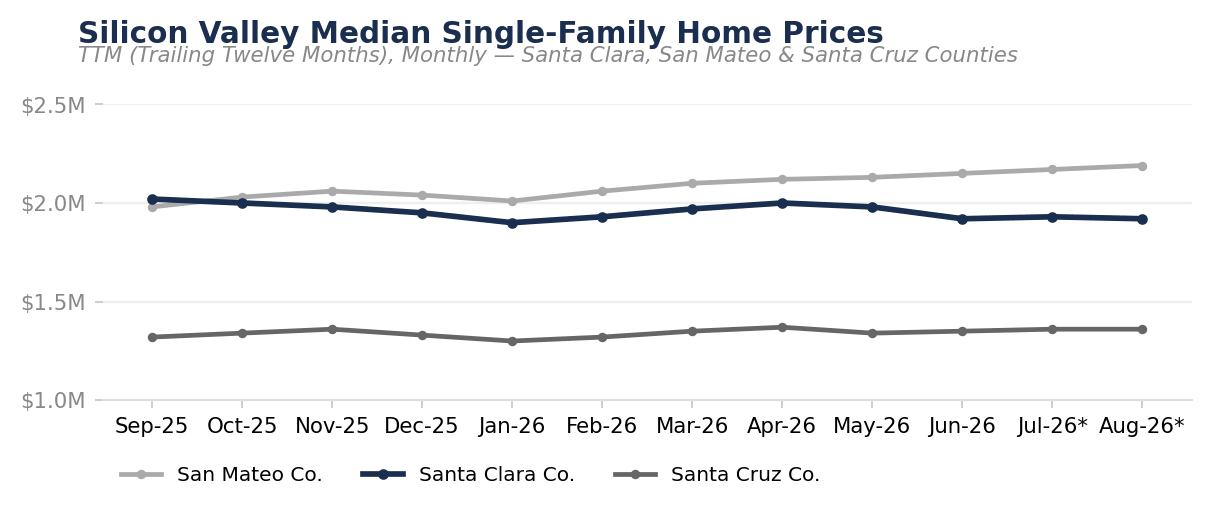
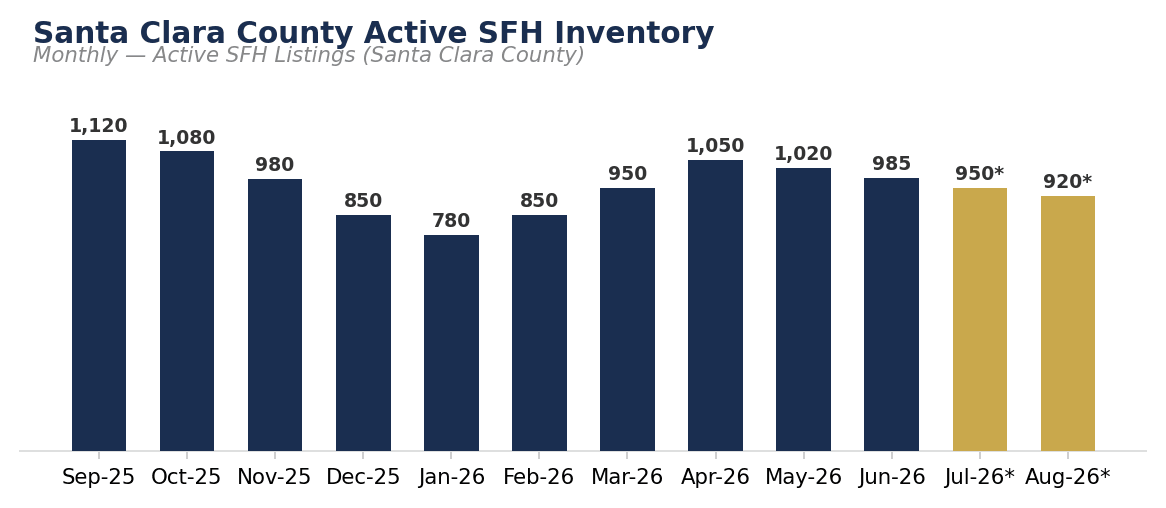
San Mateo County's single-family market accelerated through the second quarter rather than cooling into summer: the median sale price reached $2,150,000 in June, up 7.5% year-over-year and a noticeably faster pace than the roughly 3% growth the county was posting back in March. Active listings fell 18% over the same stretch, from 821 in March to 684 in June, even as homes sold three days faster (20 days versus 23 a year ago) and buyers paid a median of 103.9% of asking. Some of that strength traces directly to San Francisco's AI-fueled wealth effect spilling south down the Peninsula — Redfin recently estimated that OpenAI and Anthropic employees alone could afford to buy nearly a third of all homes in San Francisco if both companies go public this year. Santa Clara County tells the opposite story on paper: its single-family median fell roughly 9% year-over-year, the steepest decline among core Bay Area counties. But context matters here — an estimated 58,000 Bay Area tech jobs have been cut in 2026, concentrated heavily in Santa Clara County, and that labor-market drag is showing up as a shift in the mix of what's selling rather than a collapse in demand. Homes are still moving in a median of 12 days countywide, a pace that doesn't fit the profile of a genuinely cooling market. |
|
Where the Action Is: August 2026 City-by-City Spotlight
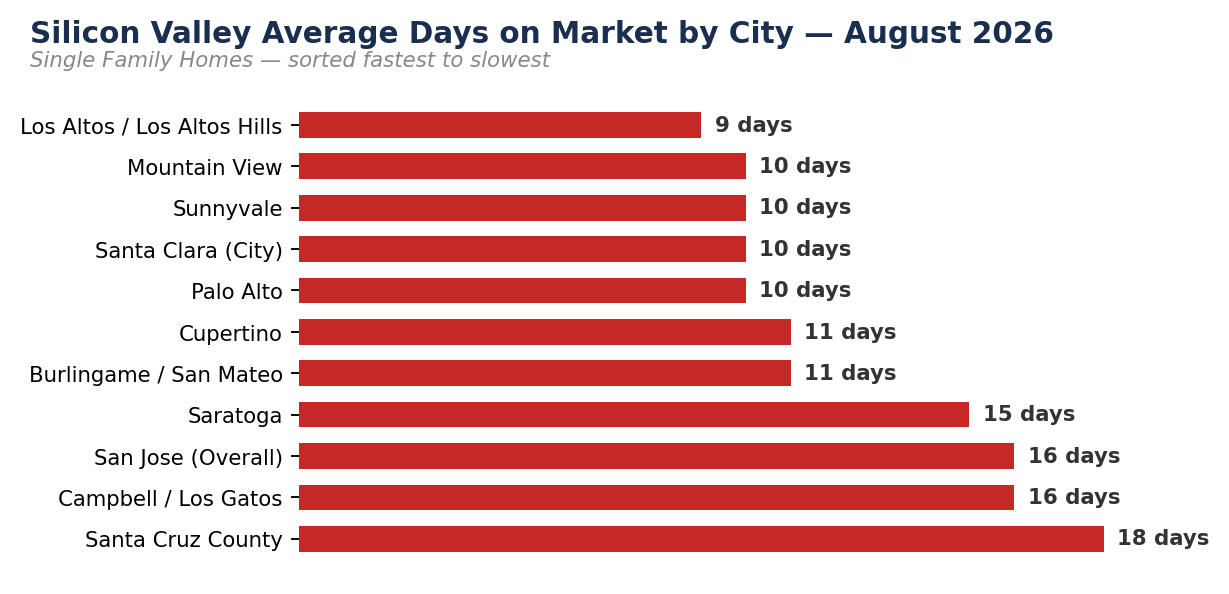
Cupertino and Los Altos remain among the valley's price leaders even as Cupertino eased further to a roughly $3.15M median amid the broader Santa Clara County pullback. Los Altos held firmer near $4.2M, with Fremont Union and Los Altos School District boundary homes still commanding the fastest offers in the county at around 9 days on market. San Jose and Santa Clara City are feeling the tech-layoff headwind most directly, given their concentration of Santa Clara County employment. San Jose's overall median has softened to roughly $1.45M, while Santa Clara City — home to the Nvidia and Intel campuses along the Great America corridor — eased to about $1.65M. Both markets are still transacting quickly, in the 10–16 day range, evidence that pricing is adjusting without demand disappearing. West San Jose — the Santana Row/Bascom/Hamilton corridor — continues to hold up better than the broader San Jose median, distinct from the more affordable Cambrian Park area to the southwest. Single-family medians in the Burbank and Westwood neighborhoods of West San Jose remain in the $1.9M–$2.2M range. Campbell, West Campbell, and Los Gatos continue to command a premium for small-town lifestyle, top schools, and Los Gatos Creek Trail access, largely insulated from the Santa Clara County median softness given their premium positioning. West Campbell — along the Saratoga and Los Gatos borders — regularly clears $2.0M–$2.2M+, while Los Gatos proper holds its small-town premium in the $2.4M–$2.8M range. Sunnyvale and Mountain View remain fast-transacting markets even as both saw modest year-over-year median softening tied to the same Santa Clara County employment pressure — Mountain View near $1.9M and Sunnyvale near $1.78M, both still moving in about 10 days. Palo Alto and Atherton remain Silicon Valley's prestige anchor, largely decoupled from the Santa Clara County tech-layoff narrative given their concentration of founder and executive wealth. Palo Alto's median held essentially flat at $3,535,000. On the Peninsula, Hillsborough posted the region's strongest single-family appreciation at a $6.0M median (+18% YoY, 141 closings, +26%), while Burlingame set records of its own at a $3.05M median (+3% YoY) on 201 closings, up 19% — pushing the blended Burlingame/San Mateo figure in our city table to roughly $2.45M. |
|
The School Premium: Silicon Valley's Most Powerful Pricing Force
Access to the Palo Alto Unified School District, Cupertino's Fremont Union High School District, and the Los Altos School District continues to command a $500,000 to $1,000,000+ premium over comparable homes in adjacent, lower-ranked districts. Notably, this premium has held even as Santa Clara County's broader median has softened under tech-layoff pressure — school-boundary homes are proving far more resilient to labor-market swings than the county median overall, since buyers in these micro-markets are disproportionately insulated by equity, dual incomes, or the very AI-sector wealth reshaping the Peninsula. It remains the single most durable pricing force in Silicon Valley real estate. |
|
Rate Lock-In Keeps Silicon Valley the Lowest-Supply Major Market in California
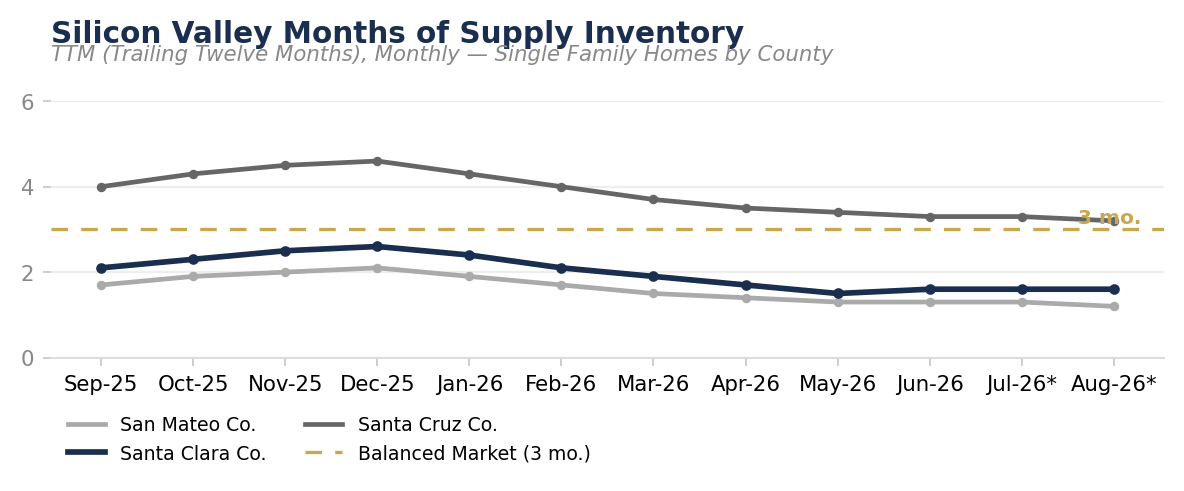
With single-family months of supply near 1.6 in Santa Clara County and roughly 1.2 in San Mateo County, Silicon Valley continues to operate in some of the most undersupplied conditions in the nation. The structural driver behind that scarcity is increasingly the mortgage-rate environment itself: nearly half of all outstanding U.S. mortgages carry a rate below 4%, with roughly one in five below 3%. Owners sitting on rates that cheap have little financial incentive to sell and take on a new mortgage near 6.7% — a "golden handcuffs" effect that may be a bigger long-term constraint on supply than anything happening on the demand side. Santa Cruz County remains the most balanced of our three counties at roughly 3.2 months of supply, continuing to draw buyers priced out of the Peninsula and South Bay. Condo supply across the region offers somewhat more breathing room — Santa Clara County's condo months-of-supply sits near 4.1 and San Mateo's near 2.9 — giving attached-home buyers meaningfully more leverage than the white-hot single-family segment. |
| Silicon Valley Data |
|
|
|
|
|
Choose your city for the detailed local market report.
Los Gatos →
Saratoga →
Campbell →
Santa Clara →
Cupertino →
Sunnyvale →
Mountain View →
Los Altos–Los Altos Hills →
Palo Alto →
| Contact Us Tim Alford & Faye Bon Christie's International Real Estate Sereno 214 Los Gatos Saratoga Rd, Los Gatos, CA 95030 (408) 832-7698 homes@alfordbon.com Team website |
| All information deemed reliable but not guaranteed. If your property is listed with a real estate broker, this is not a solicitation of brokerage services. Tim Alford & Faye Bon, DRE: 01507448 | 01746037 — Christie's International Real Estate | Sereno. TIM ALFORD DRE #01507448 · FAYE BON DRE #01746037 · SERENO GROUP, INC. DRE #02101181 Sources: National Association of Realtors; Freddie Mac 30-Year Fixed Rate Mortgage Survey; St. Louis Federal Reserve (FRED); San Francisco MLS / InfoSparks © All Source MLSs; Keeping Current Matters; Altos Research; Compass Real Estate San Mateo County Market Outlook; Redfin. |