| SARATOGA MARKET REPORT |
OCTOBER 2026 |
Alford-Bon | Tim & Faye | Sell · Buy · Invest
| |
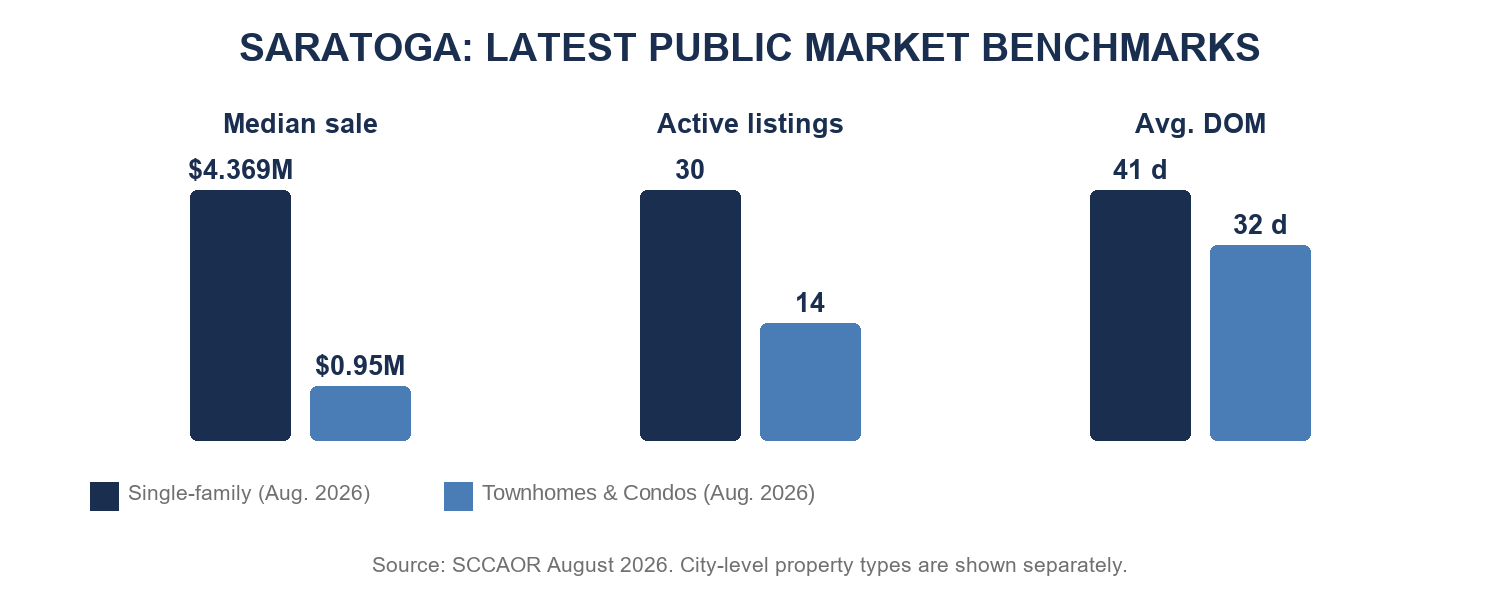
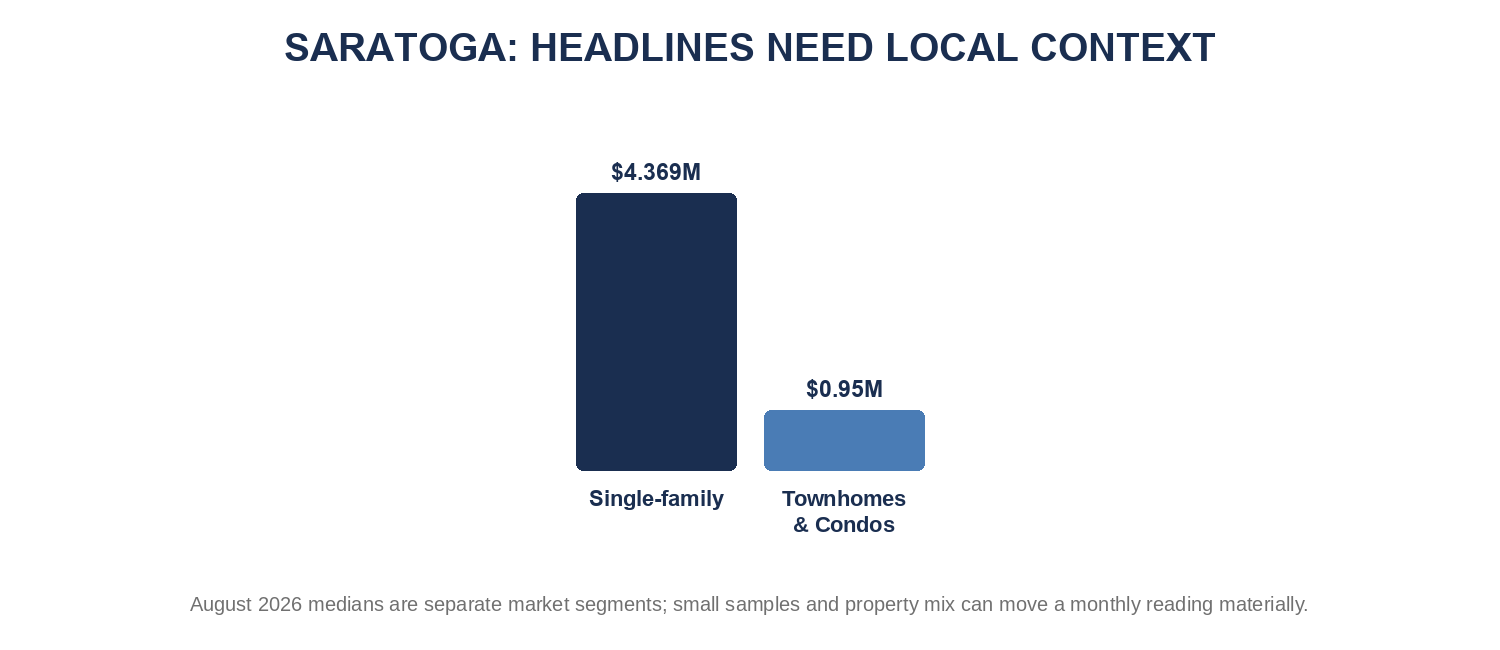
What changed since last month: financing tightened again, while Saratoga's thin sales market segments continued to make property-specific evidence more useful than a citywide headline. Single-family homes recorded a $4.369M median across 23 closings, 103% of list price, and 41 average days on market. Townhomes and condos recorded a $0.95M median across 3 closings, 102% of list, and 32 average days.
From July to August, the first segment's median changed -7.8% and the second changed -41.4%. Those are month-to-month changes in the homes that happened to close, not an appreciation measure. The practical signal is the relationship among price, pace, list-price performance, and available alternatives. A polished home priced to match recent nearby sales can still attract several buyers quickly. A nearby home may sit longer when its condition, setting, disclosures, or asking price compares poorly with other available homes.
What this means:
- Homeowners and sellers: Use recent sales of homes with a similar neighborhood, lot, size, condition, and school assignment. A citywide median based on only a few sales can be misleading.
- Buyers: Single-family homes averaged 103% of list; the 4.7-month townhome-and-condo figure rests on only three closings. Compare the closest alternatives, watch for a price change, missed offer date, or return to market, and confirm the seller's timing before seeking price or terms.
- Tim & Faye
|
|
|
Saratoga Market
The Local Pulse
|
|
August 2026 at a glance
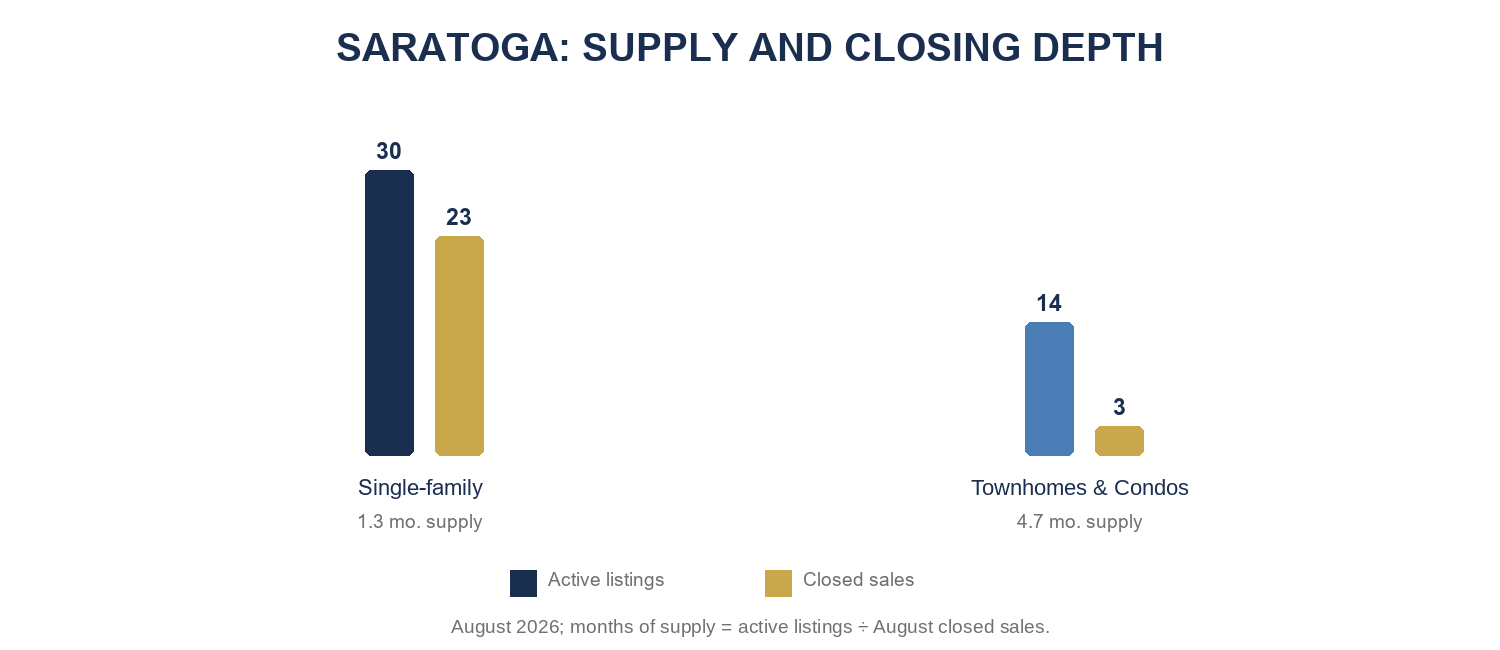
- Primary benchmark: Single-family: $4.369M median; 23 closings; 41 average days; 103% sale-to-list; 1.3 months of inventory.
- Comparison signal: Townhomes and condos: $0.95M median; 3 closings; 32 average days; 102% sale-to-list; 4.7 months of inventory.
- Selection and pace: Sample and selection: 26 closings across the shown market segments and 44 active listings; medians can be distorted when only a few homes sold or the mix of homes changed.
- Financing: the national 30-year fixed average was 7.28% on October 1. At that rate, 20% down on the $4.369M benchmark implies roughly $23,910 per month in principal and interest before taxes, insurance, and other costs. Pricing can differ by loan and borrower.
|
|
Financing & Affordability
What the October Rate Picture Means
|
|
Freddie Mac's national 30-year fixed average was 7.28% on October 1. With 20% down on the $4.369M benchmark, the illustrative principal-and-interest payment is about $23,910 per month, before property tax, insurance or other obligations. This is a planning illustration rather than a loan quote; pricing, points and borrower profiles can differ materially. The Federal Reserve raised its target range by one-quarter point on September 16; mortgage rates do not move one-for-one with that policy rate, so buyers should compare the actual fixed-rate, adjustable-rate, and buydown quotes available for their loan size.
C.A.R.'s second-quarter affordability index found that 22% of Santa Clara County households could afford the county's $2.05 million median single-family home. Its model required about $510,800 in annual income at a 6.54% effective rate. Saratoga's townhomes, conventional houses, and luxury or custom homes attract buyers with different budgets, down payments, and financing options; one regional employment headline cannot explain demand for all of them.
Many buyers are using adjustable-rate mortgages or temporary buydowns to reduce the initial payment while preserving the opportunity to refinance if fixed rates improve. That can be practical for a buyer with strong liquidity, expected income growth, or a defined holding period, but the adjustment schedule, rate caps, and future payment range should be compared with a fixed-rate option before offer day.
A targeted seller credit can sometimes address payment pressure more efficiently than a broad price reduction. Buyers should compare that benefit with the property's immediate repair, insurance, and ownership costs.
|
|
Market Behavior
What Is Moving
|
|
Entry-priced condo — 18944 Sara Park Circle. The two-bedroom, two-bath, 1,100-square-foot condo closed August 10 for $950,000. It shows a Saratoga ownership entry point well below the single-family headline, but property type, HOA obligations, size, and condition remain essential to the comparison.
Near the single-family median — 19922 Scotland Drive. The three-bedroom, two-and-one-half-bath, 2,249-square-foot home closed August 18 for $4.369 million, essentially matching August’s $4.369 million single-family median. It is a useful benchmark, not a substitute for comparing lot, condition, school assignment, and immediate competition.
Upper-market sale — 14634 Granite Way. The four-bedroom, three-and-one-half-bath, 3,371-square-foot home closed August 13 for $6.3 million. The result shows that larger, well-located Saratoga homes can attract buyers with different budgets and priorities than a typical resale.
|
|
Market Behavior
Where Activity Stalls
|
|
The long tail behind the average. Houses averaged 41 days yet sold at 103% of list, which indicates that some homes miss the first buyer wave and require a meaningful strategic reset.
Large dated estates. Renovation cost, carrying cost, insurance, and landscaping can outweigh the perceived discount when the scope is uncertain.
Pricing from an exceptional sale. A trophy comparable does not transfer automatically across school boundaries, roads, lot usability, architecture, or condition.
|
|
Regional Comparison
AI Wealth: Relevant, Not the Whole Story
|
|
Saratoga can benefit from Peninsula and San Francisco technology wealth, including emerging AI liquidity, but its market remains driven by a narrower set of family, school, privacy, and estate considerations.
AI money is more likely to expand the buyer pool for exceptional homes than to lift the entire city uniformly. The median will remain volatile because transaction counts are low and property types vary widely.
| |
Our read: Saratoga should remain durable but selective: turnkey homes with strong settings can create urgency, while project homes and thinly traded luxury properties require precise pricing. |
|
|
What Changes Next
Local Community Watch
|
|
Builder's Remedy projects moved into decisions and appeals. The four-home Oak Place proposal and 25-home Masson Estates proposal reached Planning Commission action in July, followed by appeals. That is a more concrete stage than the earlier application period.
Why residents should care. The projects test how state housing law, environmental review, hillside conditions and local design rules interact. Even 25 homes would be small relative to Saratoga's housing stock, but the decisions can shape how later proposals are reviewed.
What to watch next. Follow final appeal outcomes, any revised conditions and whether approved projects proceed to permits. This is a community-planning issue, not a material source of current resale supply.
|
|
Six-Month Outlook
Our Base-Case View
|
| Segment |
Expected direction |
Why |
| Turnkey family homes |
Competitive |
Scarce and easy to understand. |
| Village-adjacent |
Firm |
Walkability broadens demand. |
| Dated estates |
Negotiable |
Large project and carrying costs. |
| Headline median |
Volatile |
Only 23 August SFH closings. |
|
|
Prediction: The base case is a durable but highly selective market. Good homes should continue to sell above asking, while ambitious luxury and renovation-heavy properties spend longer on market. Monthly medians may swing sharply even without a comparable change in underlying value.
This is a market outlook, not a guarantee of future value. Property condition, micro-location, school assignment, lot, architecture, insurance, and financing can materially change an individual result.
|
|
Recommendations
What Matters Now
|
|
For homeowners:
- use a rolling six- or twelve-month set of truly comparable sales instead of one monthly median.
- evaluate ADU or multigenerational potential only after confirming zoning, site constraints, and realistic cost.
- Treat the $0.95M townhome-and-condo median as a three-sale sample; use a rolling set of comparable communities and units before changing a value conclusion.
For sellers:
- complete inspections and quantify major systems before launch; uncertainty is expensive in the upper tiers.
- With houses averaging 41 days yet 103% of list, set one coherent price, access and presentation plan at launch; a slow first response need not mean weak final demand.
- For hillside or upper-tier homes, quantify drainage, structure, fire insurance, access, and permits before launch; uncertainty is more expensive than visible cosmetic work in a thin buyer segment.
For buyers:
- separate cosmetic work from structural, site, drainage, and fire/insurance issues.
- verify schools directly and do not assume a mailing address determines assignment.
- For hillside homes, verify drainage, structure, fire insurance, access, septic or sewer, and permits before setting the ceiling; a cosmetic discount does not cover a site or insurability problem.
|
|