| CENTRAL SAN JOSE MARKET REPORT |
NOVEMBER 2026 |
Alford-Bon | Tim & Faye | Sell · Buy · Invest
| |
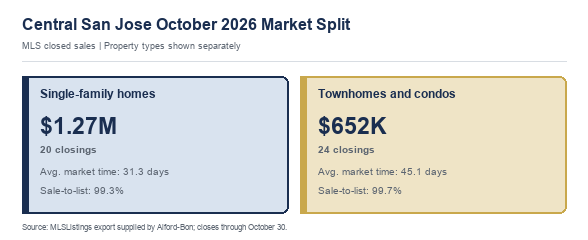
Central San Jose offered broad October selection. Across 95110, 95112, 95113 and 95126, 20 house closings had a $1.2725 million median, 99.3% average sale-to-list ratio and 31.3 average days. Twenty-four townhome and condo closings had a $652,500 median, 99.7% ratio and 45.1 days.
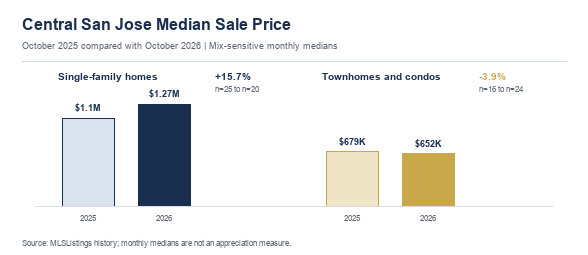
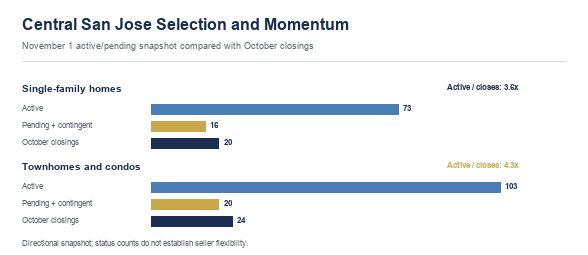
The house median was 15.7% above October 2025 across 20 closings versus 25, a location-and-size mix change, not appreciation. The median for townhomes and condos was 3.9% lower across 24 versus 16. November 1 showed 73 active houses versus 16 pending or contingent, and 103 active townhomes and condos versus 20.
What this means:
- Homeowners and sellers: Central San Jose is not one market. Separate the four ZIPs, then compare neighborhood, building or street, property type, condition, parking and access. Broad choice requires supported pricing, clean disclosures and a clear location advantage.
- Buyers: Compare like with like, not a ZIP-wide median. Track price changes, missed offer dates, returns, new competition and pendings in the same building or neighborhood, then confirm seller timing with the listing side before changing price, terms or timing.
- Tim & Faye
|
|
|
Central San Jose Market
The Local Pulse
|
|
October 2026 at a glance
- Single-family homes across 95110, 95112, 95113 and 95126: $1.2725 million October median; 20 closings; 31.3 average days on market; 99.3% average sale-to-list ratio.
- Townhomes and condos: $652,500 October median; 24 closings; 45.1 average days on market; 99.7% average sale-to-list ratio.
- November 1: 73 active versus 16 pending or contingent houses; 103 versus 20 townhomes and condos.
- Financing: Freddie Mac's October 29 national conforming-purchase average was 7.24%; $1 million fixed for 30 years is about $6,815 monthly principal and interest before taxes, insurance, points and fees.
|
|
Financing & Affordability
What the November Rate Picture Means
|
|
Freddie Mac's October 29 national averages were 7.24% for 30 years, down from 7.32%, and 6.60% for 15 years. These conventional conforming purchase-loan figures are not a Central San Jose quote or APR; loan size, points, reserves, credit, occupancy and property type affect pricing.
At 7.24%, $1 million fixed for 30 years is about $6,815 monthly principal and interest, roughly $54 less than at 7.32%. Taxes, insurance, HOA dues, points, fees and mortgage insurance are excluded; include parking, maintenance and building costs.
An ARM or temporary buydown can suit strong reserves, expected income growth or a defined holding period. Compare fixed financing and review adjustment date, index, margin, caps and maximum payment. A permitted seller credit may fund a buydown or closing costs efficiently when a listing's market response supports a terms request.
Many buyers enter with an ARM or buydown and plan to refinance if rates and qualification improve. Model resets, caps, future payments and holding period; preserve reserves. Condo buyers should include HOA dues, assessments, insurance and litigation or repair risk; house buyers should fund systems and older-home improvements.
|
|
Market Behavior
What Is Moving
|
|
Entry example - 188 West Saint James Street, No. 10917. The 516-square-foot studio closed for $376,000 after 26 days, 100.0% of its $376,000 list. This one sale shows a downtown entry point and must be compared by building, HOA, parking, condition and view.
Condo example - 38 North Almaden Boulevard, No. 500. The two-bedroom, two-bath, 1,312-square-foot condo closed for $920,000 after 28 days, 96.8% of its $950,000 list. One below-list sale does not establish a building trend.
Upper-price house example - 838 Morse Street. The four-bedroom, three-bath, 3,474-square-foot home closed for $4 million after eight days, 100.0% of its $4 million list. This one distinctive house is not comparable to a typical condo or smaller home across four ZIPs.
|
|
Market Behavior
Where Activity Stalls
|
|
Townhomes and condos have the deepest active set: 24 closings averaged 45.1 days, with 103 active versus 20 pending or contingent. HOA finances, insurance, assessments, parking, building condition, noise and monthly cost can stall a home. Compare the unit with recent pendings in the same building before treating broad supply as leverage.
House pricing must reflect location and condition. The segment averaged 31.3 days and 99.3% of list, with 73 active versus 16 pending or contingent; missed first cycles need neighborhood pending comparisons, not the four-ZIP median.
Urban properties stall when sellers price a future project or transit benefit buyers cannot use today. Separate current access, parking, construction, HOA condition and street experience from long-term potential; MLS data does not establish motivation.
|
|
Regional Comparison
Central San Jose Offers Choice Even as Individual Homes Still Move
|
|
Realtor.com Economics, quoted by NAR October 20, reported September metro pending sales down 4.6% year over year. This is not October closings across the four ZIPs and differs in method.
Active counts exceeded pending or contingent counts in both property types, yet Morse Street closed in eight days at list. Distinctive homes can move while buyers compare many alternatives.
| |
Our read: Use broad choice for building- or neighborhood-level comparisons. Sellers create urgency only when price, condition, disclosures and actual street or building experience support it. Buyers should distinguish a listing losing momentum from one simply awaiting the right property-specific buyer. |
|
|
What Changes Next
Local Community Watch
|
|
San Fernando Street work began May 2026 and is scheduled through summer 2027 from 11th Street to Almaden Boulevard, adding protected bikeways, signal changes, pavement and curbs.
Expect temporary lane, driveway and sidewalk changes. The project may improve the public realm, but current effects require block- and time-specific review. Visit during the hours that matter to the household and verify the current City phase before judging convenience.
It adds no housing supply and creates no automatic value change. Check current phase, closures and access for a property near San Fernando Street, and watch for the next construction notice rather than relying on the summer 2027 end target alone.
|
|
Six-Month Outlook
Our Base-Case View
|
| Segment |
Expected direction |
Why |
| Distinctive, well-prepared single-family homes |
Selective but competitive |
The Morse Street example closed in eight days at list even within a broad active market. |
| Typical single-family home resales |
Balanced to negotiable |
October averaged 31.3 days and 99.3% of list, with 73 active versus 16 pending or contingent on November 1. |
| Townhomes and condos |
Negotiable |
Twenty-four closings averaged 45.1 days, with 103 active listings versus 20 pending or contingent. |
| Properties near active construction |
Block-specific |
Access, noise, parking and the construction phase need current verification rather than a broad future-benefit assumption. |
|
|
Base case: distinctive homes can move quickly; condos, townhomes, typical resales and condition- or location-affected listings offer comparison and negotiation. The four ZIPs will continue to separate by building quality, parking, street experience, condition and proximity to active work.
This outlook is not guaranteed. Rates, building finances, parking, construction, neighborhood, condition, insurance and new listings can change a result.
|
|
Recommendations
What Matters Now
|
|
For homeowners:
- Separate the four ZIPs by neighborhood, building or street, property type, parking and condition before using the $1.2725 million or $652,500 medians.
- For a condo or townhome, keep HOA budgets, reserves, insurance, minutes, assessments, litigation and major-component records current; buyers can compare 103 active alternatives.
- For a house, preserve permits and systems records and track nearby competition; the four-ZIP median hides lot, architecture, street and construction proximity.
For sellers:
- Price against building or neighborhood alternatives and review showing-to-offer conversion early; 73 active houses and 103 active townhomes or condos give buyers options.
- For a condo, provide the HOA package and explain parking, storage, insurance and major projects; unresolved costs can outweigh a small price difference.
- Near San Fernando Street work, provide current access and construction facts without promising completion benefits; buyers price the present block experience. Update the disclosure if the City changes the phase before launch.
For buyers:
- Compare the closest active and recently pending alternatives in the same building or neighborhood. Track price changes, missed offer dates, returns, new competition and pendings; confirm seller timing with the listing side. Use those facts to choose a price request, different terms, delayed offer timing, or no request. Citywide figures are context, not this home's conclusion.
- For a condo or townhome, turn reserves, insurance, assessments, minutes, litigation, parking and major projects into monthly and near-term cash needs.
- Near active construction, visit at commute and off hours and verify lanes, driveways, sidewalks and parking; do not pay for an unsupported future benefit.
|
|